003 / OPERATIONAL MODELLING
Open almost any corporate presentation and the company appears as a hierarchy.
The board sits at the top. Divisions branch beneath it. Departments split into teams. Boxes and lines explain who reports to whom, where budgets sit, and how authority flows through the organisation.
That view is useful for understanding management.
It tells us surprisingly little about how the business actually works.
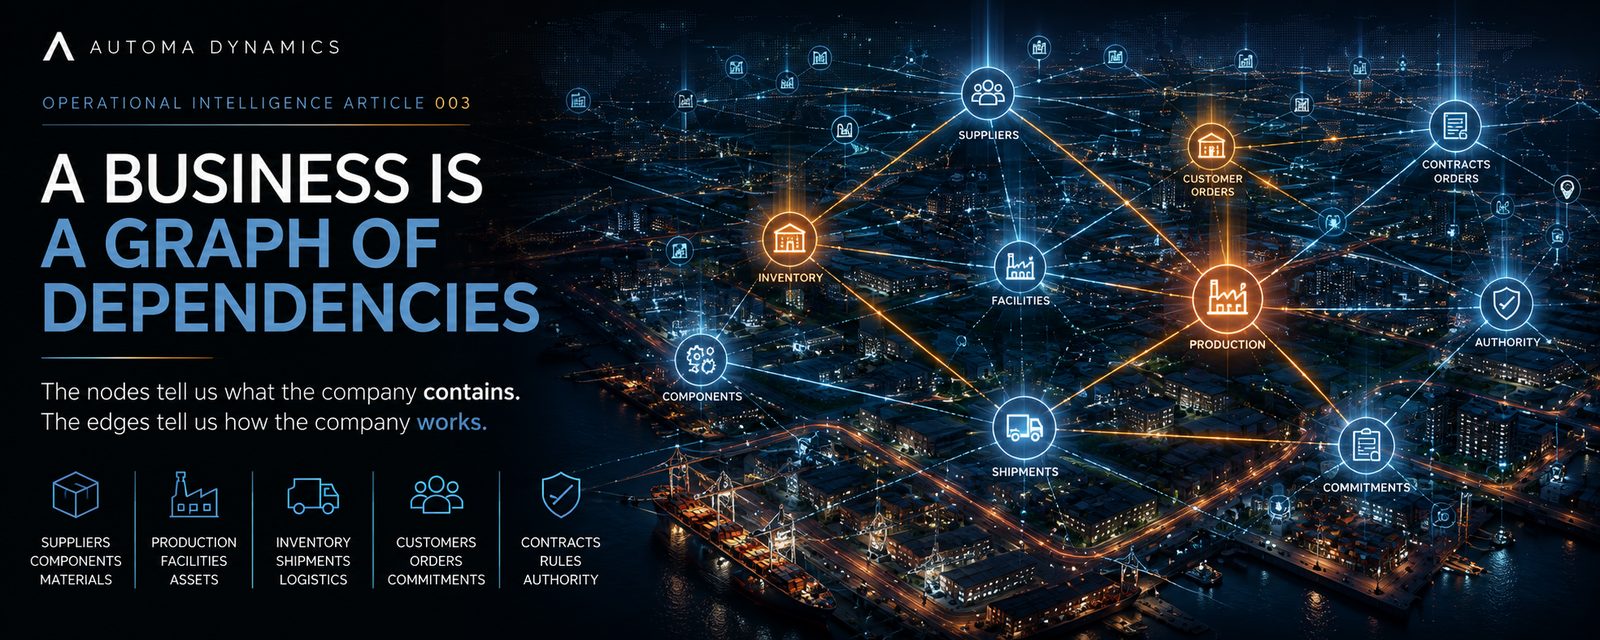
Operationally, a company looks more like a graph.
A customer depends on an order. An order may depend on production. Production depends on materials, capacity, people, machines and time. Materials depend on suppliers, inventory and transport. Transport depends on routes, ports, carriers, customs and infrastructure. Every commitment sits inside a web of other commitments.
The company continues functioning because those dependencies continue holding.
That distinction matters because most serious operational problems begin when one of them stops.
The Organisation Chart Hides the Real System
Imagine a manufacturer discovers that a critical shipment will arrive ten days late.
On an organisation chart, this appears to be a logistics problem. Logistics owns transportation, so the problem belongs in the logistics box.
Operational reality is less polite.
The shipment contains components required by several production orders. Some factories have enough stock to absorb the delay; others do not. Certain customer deliveries depend on the affected production. Some customers have flexible dates, while others have contractual commitments. An alternative shipment route exists, but it costs more and requires approval above a particular threshold.
The original event may belong to logistics.
The consequences belong to the company.
This is why organisational silos can be useful administratively while becoming dangerous analytically. Each department sees a legitimate piece of the situation, yet the important question is often what happens between those pieces.
A delayed shipment is one fact.
Understanding what depends on that shipment is where the work begins.
Records Tell You What Exists. Relationships Tell You What Matters.
Enterprise software is extremely good at recording objects.
A procurement system contains purchase orders. A warehouse system contains inventory. A transport platform contains shipments. Manufacturing software contains production schedules. Customer systems contain orders, accounts and commitments.
Each record can be perfectly accurate while the organisation still struggles to answer a cross-functional question.
Suppose we know that component X is delayed.
That fact has limited value until we know:
- which shipments contain component X;
- which locations expect those shipments;
- which products require the component;
- which production plans consume it;
- which inventory could substitute for the delayed supply;
- which customer commitments depend on the affected production;
- which decisions are available if a shortage occurs.
The meaning emerges through connection.
This is a subtle but important shift in how we think about enterprise data. Individual objects remain essential, but much of the operational intelligence lies in the edges between them.
A component matters because something requires it.
A contract matters because it governs a commitment.
An approval matters because it authorises an action.
A disruption matters because something depends on whatever has been disrupted.
The relationship is part of the fact.
Small Events Become Large Consequences Through Dependency
Complex systems often fail in ways that seem disproportionate to the event that started them.
One missing part can stop an assembly line. One unavailable specialist can delay a programme. One failed transformer can affect thousands of customers. One software dependency can interrupt services that appear unrelated from the outside.
The same principle exists throughout business.
Consider a simplified chain:
Supplier → Component → Shipment → Inventory → Production → Customer Order → Contractual Commitment
Nothing in that sequence is especially complicated by itself.
The complexity comes from the number of possible paths through the organisation.
A component may serve six products. A product may be produced at three factories. Those factories may draw inventory from several warehouses. Hundreds of orders may depend on different combinations of products, dates and priorities.
Now introduce one event.
A port closes.
Which customers are affected?
A database search for port closure cannot answer that question on its own. The consequence may never have been written anywhere because it did not exist until the event happened.
The answer has to be derived by following dependencies.
That is a different class of computation from retrieval.
The Edge Needs Meaning
Representing two things as connected is only the beginning.
The connection itself needs semantics.
A supplier produces a component.
A shipment contains a batch.
A product requires a component.
A production order consumes inventory.
A customer order depends on production.
A contract governs a commitment.
These relationships are not interchangeable. Their direction, meaning and constraints determine what can legitimately be inferred from them.
This matters enormously for AI.
If two records simply appear near each other in a search result, a language model may infer that they are connected. Sometimes that inference will be sensible. In operational systems, sensible is not always sufficient.
A business needs to know whether the relationship is real.
Was this production order actually allocated to this customer order? Does this contract genuinely govern this transaction? Is this component approved for this product? Is this inventory available to this factory?
The difference between correlation and dependency can become the difference between a useful recommendation and an expensive mistake.
Direction Matters
Dependencies have direction.
If product A requires component B, then a shortage of B can threaten A. A shortage of A does not automatically threaten B.
That sounds trivial, but direction becomes powerful when thousands or millions of relationships are involved.
The question:
"What does this customer order depend on?"
travels through the organisation differently from:
"What will be affected if this supplier fails?"
One moves upstream, looking for requirements and causes.
The other moves downstream, looking for exposure and consequences.
A useful operational model should support both.
This creates a form of organisational reasoning that ordinary reporting struggles to provide. Instead of asking only for the current value of something, we can begin asking how state propagates through the system.
What supports this?
What depends on this?
What would change if this disappeared?
Where does this consequence end?
Those are graph questions in the deepest sense, regardless of which database technology eventually answers them.
Time Changes the Graph
Business dependencies are rarely permanent.
Suppliers change. Contracts expire. Inventory moves. Production schedules are revised. Orders are fulfilled. Approvals are granted and later superseded. A relationship that was true yesterday may no longer be true this morning.
This means a useful operational graph cannot be treated as a static diagram.
It is a graph of state through time.
Consider the statement:
Warehouse A has 4,000 units available for Production Order B.
Several hours later, 2,000 units may have been allocated elsewhere. The relationship between inventory and production has changed even if both objects still exist.
The same applies to commercial relationships. A customer order may once have depended on one production run and later be reassigned to another. A supplier may be approved for a component today and suspended tomorrow.
Understanding the company therefore requires more than knowing that two objects can relate.
The system needs to know when that relationship was valid and what changed it.
This is where operational history becomes part of operational intelligence.
A Graph Does Not Require a Graph Database
It is worth separating the conceptual model from the storage technology.
Saying that a business behaves like a graph does not mean every company needs to move its data into a specialised graph database.
Relational databases can model relationships extremely well. Event stores can preserve temporal change. Search systems can retrieve documents. Warehouses can aggregate enormous datasets. Different technologies solve different parts of the problem.
The architectural question comes first:
Can the organisation represent the objects that matter and the meaningful relationships between them?
Storage is an implementation decision.
Ontology is a modelling decision.
That distinction is important because enterprise technology has a tendency to turn conceptual problems into procurement categories. A graph-shaped understanding of the company is valuable whether the underlying implementation uses tables, documents, events, graph structures, or some combination of them.
The objective is not fashionable infrastructure.
The objective is a coherent operational model.
Dashboards Flatten Dependency
Traditional dashboards usually show the state of the business through aggregation.
Revenue this month.
Inventory by region.
Orders at risk.
Average delivery time.
Factory utilisation.
These views are useful because human attention is limited. Aggregation allows us to see patterns quickly.
The trade-off is that dashboards often flatten the relationships responsible for the number.
Suppose a dashboard reports:
18 customer orders at risk
The obvious next question is:
Why these 18?
A useful system should be able to move from the aggregate back into the dependency structure that produced it.
Perhaps twelve orders depend on the same delayed component. Four depend on a factory outage. Two depend on an unrelated supplier problem.
Those situations may require completely different responses.
The number alerts us.
The graph explains it.
This becomes particularly important once AI starts interacting with the dashboard. A model can summarise the metric beautifully. Operational intelligence requires access to the structure beneath it.
AI Needs More Than Context
Modern enterprise AI is often described as a context problem.
Give the model the right documents, database rows, messages and tool outputs, and it can reason about the organisation.
Context certainly matters.
Structure determines what the context means.
Imagine giving an AI every relevant record concerning a delayed shipment: supplier details, inventory reports, manufacturing plans, customer orders and contract documents.
The model now possesses a remarkable amount of information.
It still needs to understand which facts connect.
Which inventory can actually satisfy which production requirement? Which production order serves which customer commitment? Which contract applies to which order? Which alternative supplier is approved for which component?
More context gives the AI more pieces.
A dependency model tells it how the pieces fit together.
That may become one of the defining differences between enterprise assistants and genuinely operational AI.
An assistant can find information about the company.
An operational system needs to reason over the company's structure.
Dependencies Create Explainability
Graphs also provide a natural foundation for explanation.
Suppose an AI recommends expediting a shipment because a customer commitment is threatened.
A weak explanation might say:
"Based on current supply-chain conditions, expedited freight is recommended to reduce delivery risk."
The language sounds reasonable and tells us almost nothing.
A stronger system can expose the path that caused the recommendation.
The shipment contains a constrained component. The component is required by a scheduled production order. Available inventory does not cover the requirement. That production order supports a customer delivery. The projected delay crosses a contractual threshold.
Now the user can inspect each relationship.
If one edge is wrong, the conclusion can be challenged.
Perhaps the inventory allocation is outdated. Perhaps another production run can fulfil the order. Perhaps the contract was amended yesterday.
The system does not merely present a conclusion.
It reveals the dependency path that produced it.
That is a much stronger form of explainability than asking a language model to produce more persuasive prose.
Dependencies Also Define Blast Radius
The same reasoning applies beyond supply chains.
If a software service fails, what processes depend on it?
If a facility loses power, which operations stop?
If a regulation changes, which contracts and products are affected?
If a cyber incident compromises one identity provider, which systems and users inherit the exposure?
If a robot fleet receives a faulty software release, which customers, sites and obligations are implicated?
In every case, the key question is some version of:
What depends on this?
This is the operational blast radius.
Organisations already attempt to understand it through business continuity plans, dependency maps, architecture diagrams, spreadsheets, tribal knowledge and specialist teams.
The challenge is making that knowledge sufficiently structured, current and connected that software can reason over it continuously.
That capability becomes increasingly valuable as organisations move faster and machines gain more agency.
A Machine-Readable Company
There is a larger idea hiding underneath all of this.
Most companies are technically digital while remaining only partially machine-readable as systems.
Their transactions are digital. Their documents are digital. Their communications are digital. Their telemetry is digital.
Yet the meaning connecting those things often still lives in human heads.
Someone knows that this spreadsheet overrides that report.
Someone knows that this supplier record is the same company as another record under a different name.
Someone knows that a particular customer must always be prioritised.
Someone knows that a production line cannot use inventory stored at a certain location without an additional inspection.
People carry enormous amounts of invisible relational knowledge.
When those people leave, change roles or simply go on holiday, the system becomes harder to understand.
Making a company machine-readable means gradually externalising that structure.
Objects receive stable identities.
Relationships receive explicit meaning.
State receives time.
Assertions receive evidence.
Actions receive authority.
The organisation becomes something software can interrogate without pretending that every answer already exists in a document.
From Seeing the Company to Understanding Consequence
The first generation of enterprise AI has made organisational information dramatically easier to access.
That alone is transformative.
The next step may be more profound.
When software can traverse the dependencies that connect suppliers, assets, inventory, production, customers, commitments, people and decisions, it becomes possible to ask questions that traditional systems rarely answer directly.
What happens if this changes?
What depends on this?
Where does the risk propagate?
Which commitments become exposed?
What alternatives still satisfy the constraints?
Who needs to decide?
Those questions move us from information retrieval toward operational reasoning.
And as machines begin participating more directly in business decisions, that distinction will become critical.
A company can own enormous amounts of data and still be difficult for software to understand.
The breakthrough comes when the system can see how the pieces depend on one another.
The nodes tell us what the company contains. The edges tell us how the company works.